Welcome to the 47 NEW Biotech Innovators who have joined us this month! If you haven’t subscribed, join the 1,279 researchers, investors, operators, academics, clinicians and entrepreneurs by subscribing here:
Hello Avatar! Welcome back for another week of biotech analysis. This week we are going to revisit a highly controversial topic from earlier in the year - the Haves vs. the Have Nots. BowtiedBiotech readers will recall we featured a review of the super interesting piece from RA Capital which not only introduced the Haves vs Have Nots into the lexicon, but also backed up their assertions with one of the most interesting industry data analyses of 2023. The hypothesis was that there are two universes biotech companies, those backed by bluechip institutional investors (Have’s), and everyone else (Have Nots). The analysis showed that the Haves were well capitalized and unlikely to have problems with cash runway. It also went on to show 90%+ of the time it is the Haves that are being acquired by pharma. Now that we have over half a years worth of data they are back with a refresh and we are here to provide our analysis.
If you're not subbed - it's $5 a month, the price of a grande! The Thursday market updates will remain FREE and under the paid umbrella. The Sunday Building Biotech Series is intended to be more forward looking. Monday’s equity research will focus on Aceleryin ($SLRN) with their upcoming Ph2/3 readout from izokibep (IL17A).
Please help spread the work by subscribing and hitting the share button if you are enjoying our bi-weekly newsletters!
As a reminder, the purpose of the BowTiedBiotech substack is two-fold. Primarily, we aim to provide our scientist audience the tools to build a biotech company and ultimately translate their ideas into medicines for patients. Secondarily, biotech investors may find this substack useful as we will be providing weekly market updates of the public AND private markets as well as heavily leveraging current financing events as teaching examples.
Enough shilling for the day, lots to cover this week, let's get started!
HAVEs VS HAVE NOTs - PART II
Today we are going to revisit a fascinating and somewhat controversial topic introduced by Peter Kolchinsky and the RA Capital team earlier in the year - The Have’s and the Have Nots. Essentially the RA team laid out a compelling analysis as to why biotech companies capitalized by blue chip investors have competitive advantage in terms of extending cash runways and even eventually getting acquitted.
If you need to brush up on the original analysis it can be found here: Semper Maior: Time to Reboot Biotech . We also encourage you to revisit our comments: Epoch 4: Biotech Market Health - Down the Rabbit Hole
Today we are excited to take you through the update to the original analysis: SEMPER MAIOR RA Capital's 1H23 Core Biotech Report. Now that we are more than halfway through 2023 there is a significant substrate of financings and deal activity to analyze to test the original hypothesis.
The core of the hypothesis is that the biotech ecosystem can be broken down into two groups Core and Peripheral. Simply put, the Core group is the set financed by professional investors, whereas Peripheral is not - often with a large percentage of retail investors.
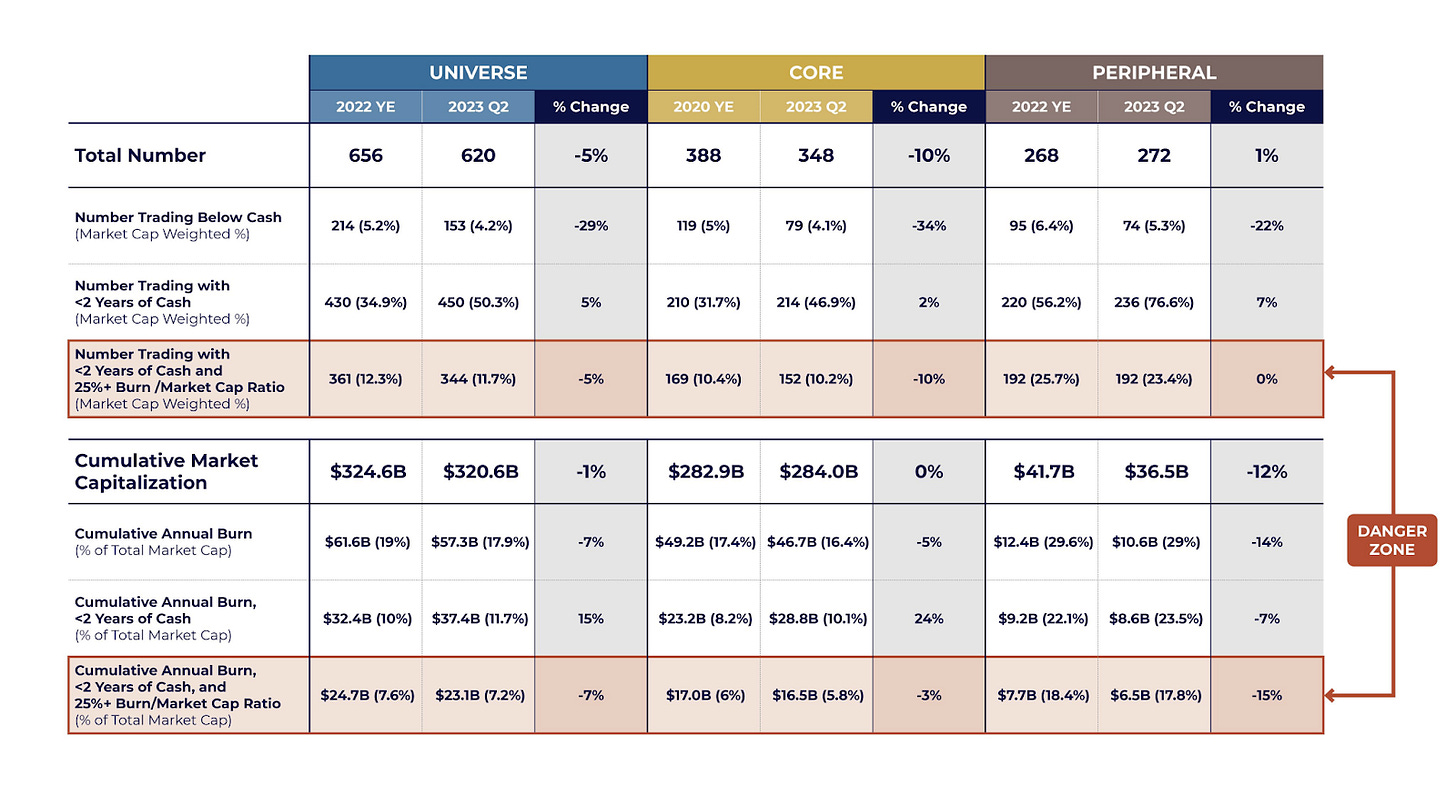
As an update, since the initial analysis was released in January the number of Core biotech companies has retracted by 10%, while the market cap for the Core set has remained the stable with burn decreasing by 5%. This is consistent with the general trend of biotech consolidation (plus limited IPO activity), and sharp focus on burn management. (see table below)
On the M&A side, there were 15 acquisitions which returned $52B to Core investors - as you will see there is a strong confirmation of the hypothesis that bluechip investors drive M&A.
Looking at cash runways, below one can see the number of Core companies in the financing Danger Zone (companies with <2yrs of cash that are trading with a burn/market capitalization ratio >25%) fell by -10% from 169 to 152, but they remain a modest 10% of Core’s total market cap.
Here is a wild metric to wrap your head around. The Core set represents 89% of the Universe’s valuation but only contains 56% of its companies. That means more than half of the biotech universe could disappear and have minimal impact on valuation!
Keep reading with a 7-day free trial
Subscribe to BowTiedBiotech to keep reading this post and get 7 days of free access to the full post archives.


