

When Consensus Gets Distorted | Ep. 1032
Using Consensus Distortion Index (CDI) & Options Volatility to Trade Biotech Narratives
Hello Avatar! Welcome back for another week of biotech analysis. Today is Sunday, which means this is our Building Biotech newsletter that is focused on discussing biopharma strategy topics. This week, we stepped beyond the biotech headlines to dissect something deeper, how investor perception distorts reality, and how to trade that distortion. Using the Consensus Distortion Index (CDI) paired with options market data, we explored a new lens for understanding when sentiment breaks from fundamentals. We will show you how this framework helps decode crowd psychology, anticipate volatility, and capture edge in a market where expectations matter more than facts.
We are now publishing 7x per week according to the following cadence:
Mondays: Stocks
Tuesdays: Biotech
Wednesdays: Podcast
Thursdays: Markets
Fridays: News
Saturdays: Podcast
Sundays: Strategy
We are also publishing unique content on X - be sure to follow up if you are not already @BowTiedBiotech. And to check-out the archive of our work on X you can find it on our website at: BowtiedBiotech.subtack.com/x-articles.
SUBSCRIBE TO PODCAST HERE:
Please help spread the work by subscribing and hitting the share button if you are enjoying our bi-weekly newsletters!

Enough shilling for the day, lots to cover this week, let's get started!
The Signal Behind the Noise
In biotech, it’s never just about the data. It’s about the interpretation of the data, and the consensus forming around it.
But here’s the dirty secret: that consensus is often warped.
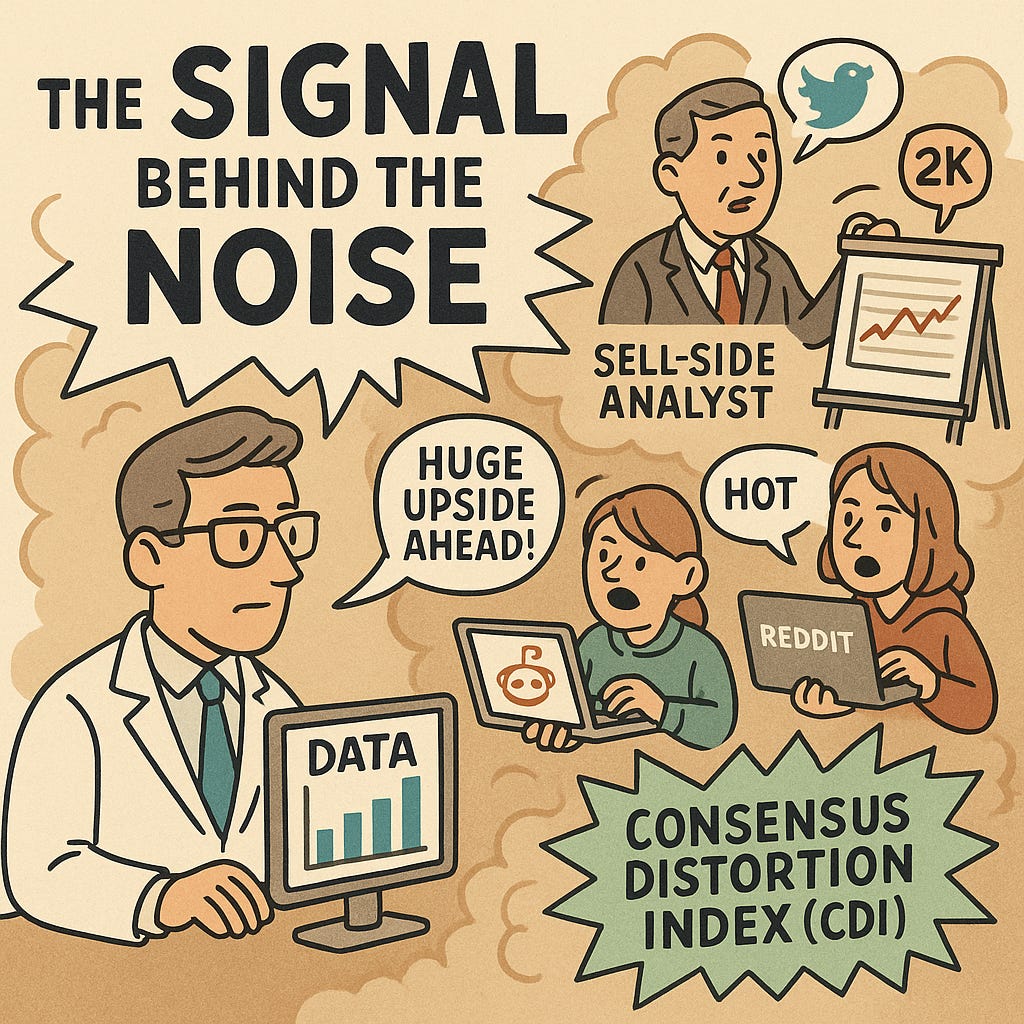
X accounts with 2,000+ followers can set the tone for a ticker’s trajectory. Sell-side analysts cling to price targets pinned to outdated slides. Reddit, Discord, Substack, and whisper networks amplify selective optimism or doom.
That’s why we built the Consensus Distortion Index (CDI), a way to quantify when sentiment breaks from fundamentals. Not just to flag hype. But to find dislocations, frame risk, and build positions when the Street is staring in the wrong direction.
What Is CDI, Really?
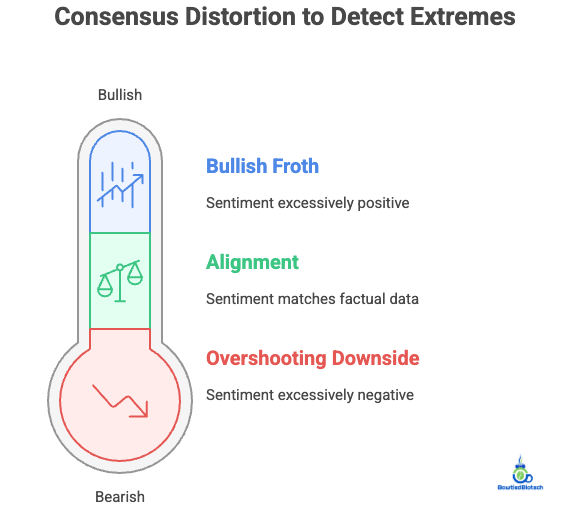
CDI takes snippets (e.g., headlines, tweets, notes, threads) and scores them on sentiment. It weights each one by reach and accuracy, then averages across a ticker. The result? A single number that shows whether investor emotion is running ahead of, behind, or in line with the facts.
A CDI near zero means alignment. A CDI above +0.5 means bullish froth. Below –0.5? Sentiment is likely overshooting the downside.
And when you pair CDI with implied volatility (IV) from options pricing, you can build trade setups that don’t just bet on direction, but on the shape of the crowd’s delusion.
The Matrix of Mispricing
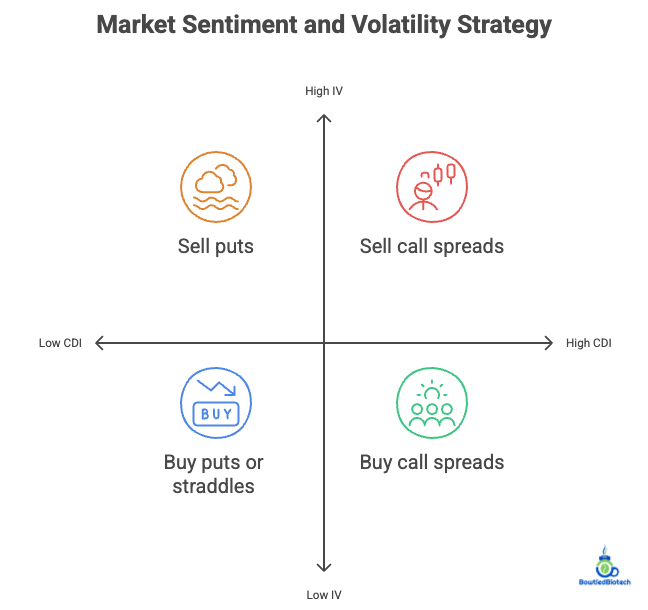
We mapped CDI against 30-day Implied Volatility (IV) Rank and found four clear quadrants:
CDIIV Rank Setup
High CDI + Low IV: Euphoria not priced → Buy call spreads
High CDI + High IV: Everyone’s hot → Sell call spreads, fade the crowd
Low CDI + Low IV: Fear unpriced → Buy puts or straddles
Low CDI + High IV: Panic already priced → Sell puts, fade vol
Each of these setups is about misalignment.
Either the crowd is talking big but the options board is asleep, or everyone’s bracing for doom while sentiment is quietly mean-reverting.
The KYMR Case Study
In June 2024, Kymera ($KYMR) dropped its first Phase 1 data for KT-253, an MDM2 degrader. The science looked solid, deep degradation, p53 activation, early hints of efficacy. But the story was already cooking online.
Our CDI came in at +0.8. Enthusiasm was everywhere. “First real MDM2 win,” one tweet claimed. “Could reshape the p53 field,” said another blog.
Options markets agreed. Implied vol was sky high, 74% IV Rank, pricing in a double-digit move. But the stock barely budged, and volatility collapsed. Why?
Because everyone already believed.
That’s your setup: high CDI, high IV. Crowd + market both hot. The data had to be perfect to justify the price. It wasn’t bad, it just wasn’t surprising. The trade? Sell the pop, harvest the crush.
When the Street Is Sleeping
Flip the setup. Take $VRTX and its ADA 2025 data for zimislecel. CDI clocked in at 0.3 going in. Skepticism lingered, manufacturing scale, price risk, transplant logistics. Meanwhile, IV was elevated, pricing in downside.
But the data hit: 10 of 12 patients off insulin, good durability. The result? A +6% pop and a sharp IV crush.
That’s low CDI, high IV. No one believes. Everyone’s hedging. But when the surprise is to the upside, you get convexity. The market snaps back. Traders lose premium.
In that setup, we like selling puts or short strangles against a rebound. You’re getting paid to bet that the crowd’s wrong, and that volatility will die.
How to Systematize It
You don’t have to guess. You can build a dashboard:
CDI: scrape, score, weight, average.
IV Rank: 30-day percentile from options chain.
Catalyst overlay: earnings, data, FDA, JPM, conf.
Then filter:
CDI > +0.5 and IV Rank < 40%? → Buy upside.
CDI > +0.5 and IV Rank > 60%? → Sell froth.
CDI < –0.5 and IV Rank < 40%? → Load downside.
CDI < –0.5 and IV Rank > 60%? → Fade fear.
Each setup gives you a reason, a structure, a hedge.
Why It Works
Biotech isn’t efficient. Coverage is thin. Retail flow distorts reality. And the stakes (e.g., data, death, dollars) create wild emotional swings.
CDI taps into that emotional layer. It shows what people think will happen. IV shows what they’re paying to hedge or chase that belief.
Put the two together and you’re not just trading data. You’re trading expectation dislocation.
In a market where speed matters less than timing, this gives you edge.
Translational Alpha
CDI also gives you a window into how the Street is digesting early science.
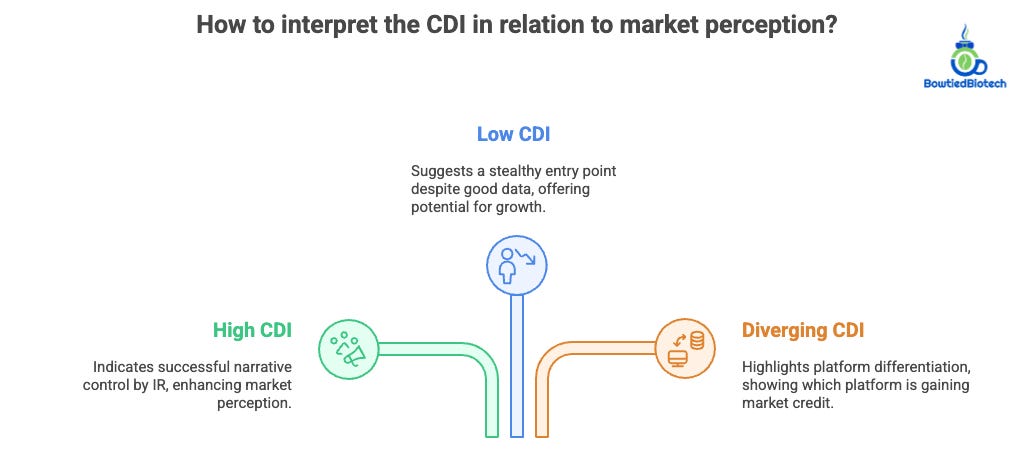
A high CDI off a press release? IR is winning the narrative battle.
A low CDI despite good preclinical data? You’ve got a stealthy entry point.
CDI diverging from peer names? One platform’s getting credit, the other isn’t.
It’s a new kind of diligence. One that goes beyond mechanism. You’re asking: what does the market think this is? And where is it wrong?
Feedback Loops and Inflections
CDI isn’t static. It shifts with commentary. A slow bleed into negativity is often more predictive than a sharp spike. A snapback from –0.8 to +0.2 can tell you that someone with real reach just flipped.
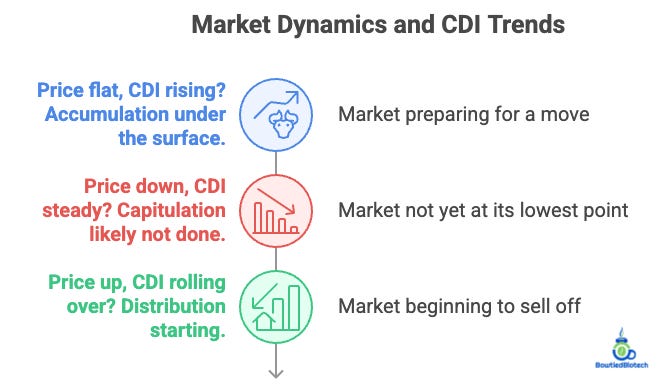
Track it over time. Layer it with price. Look for inflections:
Price flat, CDI rising? Accumulation under the surface.
Price down, CDI steady? Capitulation likely not done.
Price up, CDI rolling over? Distribution starting.
This is tempo, not just level. And in biotech, tempo drives tape.
The Opportunity You Didn’t Know You Had
Everyone trades catalysts. But most traders are flying blind when it comes to expectations. They chase the tape, overpay for protection, or get chopped by whipsaws.
With CDI + IV, you can flip the script.
You’re not betting on data. You’re betting on how wrong the market is about what the data means, and whether it’s already priced in.
This isn’t just a tool for traders. Scientists, IR teams, and PMs can use it to anticipate reactions, shape narratives, and allocate attention.
Biotech is messy. But if you can quantify sentiment distortion and pair it with option pricing, you get something rare:
A map of mispricing.
And maps are how you find edge, before everyone else does.
CONCLUSION
Today, biotech investors face more noise than signal. But by tracking how sentiment bends around key catalysts, and pairing that with what the options market is actually pricing, we can start to see the cracks in consensus before they widen. Whether you’re managing risk, building conviction, or just trying to avoid the next head-fake, CDI + IV isn’t just a tool. It’s a compass. And in a market driven by interpretation, that might be your most important edge.
As a reminder, if looking to go deeper into the topics we cover check out our website BowTiedBiotech.com, or DM us on twitter, or email us: bowtiedbiotech@gmail.com
DISCLAIMER
None of this is to be deemed legal or financial advice of any kind. All updates are sourced from publicly available disclosures. Insights are *opinions* written by an anonymous cartoon/scientist/investor.
TOP BOWTIEDBIOTECH NEWSLETTERS